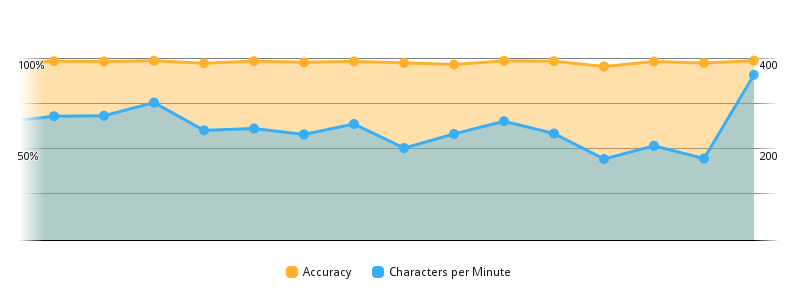
After finishing the keyboard layout editor here in Randa I've started working on the last remaining big task of the upcoming new version of KTouch: the summary screen which will be shown after the user has completed a lesson. For that I want to display the user's learning progress with pretty diagrams. As there are no ready-made components for Qt Quick for that purpose right now, I've sat down and started to implement my own:

My QML component to render such graphs is actually pretty generic. Here is the complete code for the screenshot above:
import QtQuick 1.1
import org.kde.plasma.core 0.1 as PlasmaCore
import org.kde.plasma.components 0.1 as PlasmaComponents
import org.kde.ktouch.graph 0.1 as Graph
import ktouch 1.0

Rectangle {
    width: 800
    height: 300
    anchors.centerIn: parent
    color: "white"

    Column {
        anchors {
            fill: parent
            topMargin: 2 * spacing + legend.height
            leftMargin: spacing
            rightMargin: spacing
            bottomMargin: spacing
        }

        spacing: 20

        Graph.LineGraph {
            width: parent.width
            height: parent.height - legend.height - parent.spacing
            model: learningProgressModel

            dimensions: [
                Graph.Dimension {
                    id: accuracyDimension
                    dataColumn: 5
                    color: "#ffb12d"
                    maximumValue: 1.0
                    label: i18n("Accuracy")
                    unit: "%"
                    unitFactor: 100
                },
                Graph.Dimension {
                    id: charactersPerMinuteDimension
                    dataColumn: 6
                    color: "#38aef4"
                    maximumValue: 400
                    label: i18n("Characters per Minute")
                }
            ]
        }

        Row {
            id: legend
            anchors.horizontalCenter: parent.horizontalCenter
            spacing: 20

            Graph.LegendItem {
                dimension: accuracyDimension
            }
            Graph.LegendItem {
                dimension: charactersPerMinuteDimension
            }
        }
    }
}
The model used as the data source for the graph—learningProgressModel—is just a normal QAbstractTableModel descendant.