The plugin now provides three new QML types: ChartModel and Record. The first type implements QAbstractTableModel, so it can directly hooked up with a chart as its source model. The other allows to easily describe the model's data in QML making it trivial to draft a simple QML chart demonstration:
import QtQuick 1.1
import org.kde.charts 0.1
Rectangle {
color: "white"
width: 800
height: 400
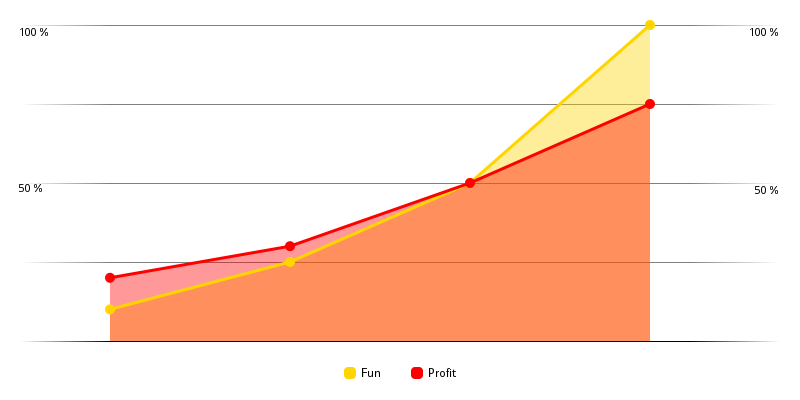
ChartModel {
id: chartModel
columns: 2
Record {
values: [0.1, 0.2]
}
Record {
values: [0.25, 0.3]
}
Record {
values: [0.5, 0.5]
}
Record {
values: [1.0, 0.75]
}
}
Column {
anchors.fill: parent
anchors.margins: 20
spacing: 20
LineChart {
model: chartModel
width: parent.width
height: parent.height - legend.height - parent.spacing
pitch: 180
dimensions: [
Dimension {
id: funDimension
color: "#ffd500"
dataColumn: 0
minimumValue: 0.0
maximumValue: 1.0
label: "Fun"
precision: 0
unit: " %"
unitFactor: 100.0
},
Dimension {
id: profitDimension
color: "#ff0000"
dataColumn: 1
minimumValue: 0.0
maximumValue: 1.0
label: "Profit"
precision: 0
unit: " %"
unitFactor: 100.0
}
]
}
Row {
id: legend
spacing: 30
anchors.horizontalCenter: parent.horizontalCenter
LegendItem {
dimension: funDimension
}
LegendItem {
dimension: profitDimension
}
}
}
}
The file can be directly run with qmlviewer, in fact I have used it to generate the screenshot in the original announcement for this project.[1] There are no C++ components required anymore to leverage the charts plugin.[2]
The way the demo employs ChartModel obviously doesn't reflect how most applications want to use the charts plugin. Static data isn't encountered what often after all. For this case ChartModel offers a set of methods to dynamically manage its data. I am currently developing a second, more complex demo illustrating their use.
Update Mar 12th, 2014: The seperate Value type is gone by now. I have updated both text and the code sample reflecting changes.